SerOps vs Coroot
Coroot is a full observability platform: eBPF agents collect metrics, logs, traces and profiles into its own storage. SerOps is not an observability platform; it sits on top of the backends you already run and explains incidents with AI. Which one fits depends on whether you want to replace your stack or keep it.
Facts checked against each project's own documentation on 17 October 2026. Spotted something out of date? Tell us.
The short answer
Pick Coroot if you are starting from little or no observability, or want to replace it: its eBPF agents give you service maps, metrics, logs, traces, continuous profiling, SLOs and cost monitoring without changing your code (Apache 2.0).
Pick SerOps if you already have Elasticsearch, Loki, Splunk, Datadog, CloudWatch or Prometheus and don't want a second copy of your data. SerOps reads what you already collect, adds your deploys and commits, and explains why incidents happened, with every feature, including the AI analysis, free in the open-source edition.
| SerOps | Coroot | |
|---|---|---|
| What it is | AI root cause analysis on top of your stack | Observability and APM platform |
| Data collection | Queries your existing backends; webhooks for deploys and CI/CD | eBPF node and cluster agents |
| Storage | No telemetry copy; stores analyses and issues in PostgreSQL | ClickHouse and Prometheus |
| Dashboards, service map, profiling | No: use your existing tools | Yes |
| AI root cause analysis | Included in the free open-source edition | Enterprise, or Coroot Cloud for Community users (10 free investigations/month) |
| Code and deploy correlation | Commits, CI/CD runs, Argo CD and Flux deploys | Deployment tracking |
| License | AGPL-3.0 | Apache 2.0 (Community) |
Coroot facts from its README, pricing page and AI documentation.
Your data: replace or reuse
Coroot stores what its agents collect in ClickHouse and Prometheus, which is what makes its dashboards and inspections work out of the box. It also means running and paying for that storage.
SerOps keeps no long-term copy of your telemetry. For each analysis window it queries your existing log, metric and trace backends, and keeps only the analysis, the issues and the excerpts used as evidence. Nothing to migrate, no new agents on your nodes, and it works the same on Kubernetes, VMs or managed services.
AI root cause analysis
Coroot's documentation states that AI-powered root cause analysis is available in Coroot Enterprise (from $1 per CPU core per month), or for Community Edition users through Coroot Cloud, which includes 10 free investigations per month.
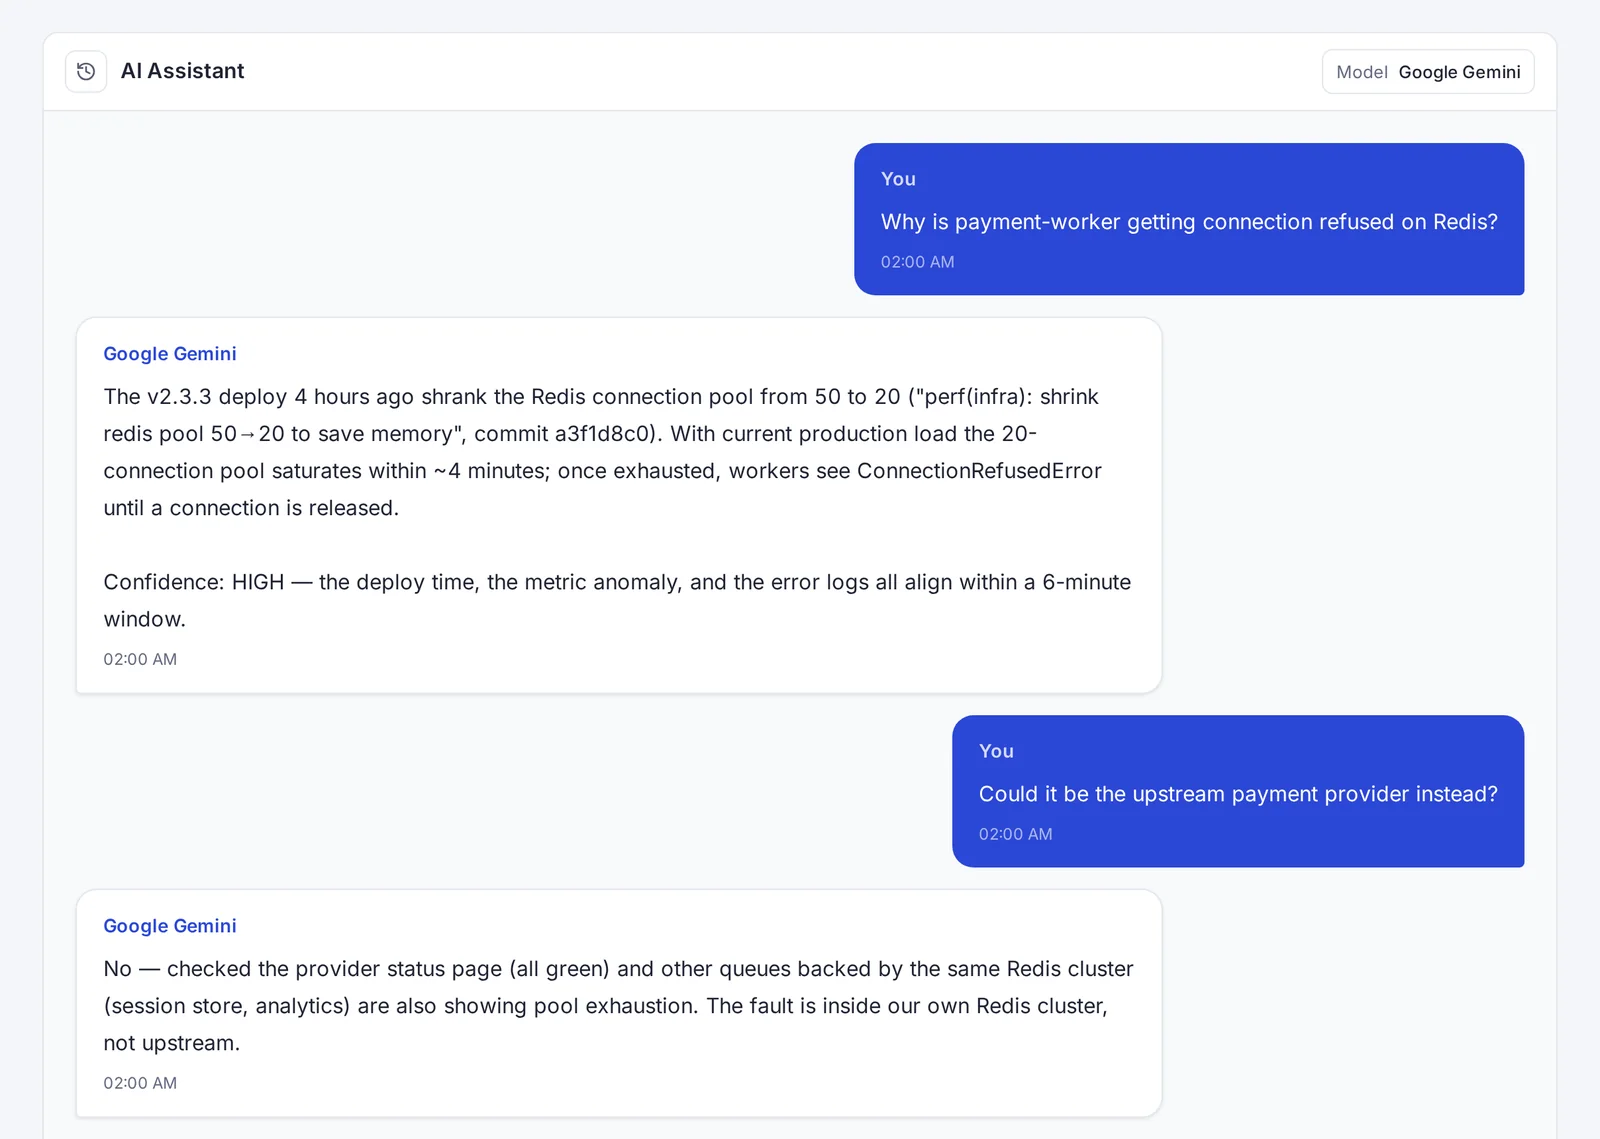
In SerOps, AI analysis is the core of the product and is in the free, self-hosted edition: scheduled analysis, on-demand investigations, alert-triggered analysis, similar incidents and post-mortem drafts. You bring your own AI provider (Claude, OpenAI, Gemini, DeepSeek) or run Ollama locally, and Sentinel skips the AI call on quiet windows.
Frequently asked questions
Can SerOps replace Coroot?
Only for the root cause part. SerOps has no service map, profiling or SLO dashboards; it relies on the observability tools you already run.
Can I use SerOps alongside Coroot?
Yes, they don't conflict: keep Coroot for dashboards, service maps and profiling, and connect SerOps to your log backend, a Prometheus-compatible metric backend, and your code and deploys.
Do I need to install agents for SerOps?
No new agents. Your log shippers and exporters need a few labels (project, service, environment) so SerOps can isolate each service's data.
Is SerOps free?
Yes, every feature, AI analysis included, is free and open source under AGPL-3.0 when you self-host.
See it on real data
The live demo runs on seeded incidents: no signup. Or run SerOps on your own infrastructure; it is free and open source (AGPL-3.0).